KiCad SPICE Simulation
KiCad SPICE Simulation Tutorial
Resources
- KiCad Simulation Documentation: docs.kicad.org — Spice Simulation Guide
- ngspice Engine Manual: ngspice.sourceforge.io — User Documentation
- KiCad Community Forum: forum.kicad.info — Simulation Tips & Tricks
- KiCAD Video Tutorial (slightly dated): https://www.youtube.com/watch?v=3_XpWt_rTaU
Video
This related video shows how to simulate a low-pass filter in KiCAD
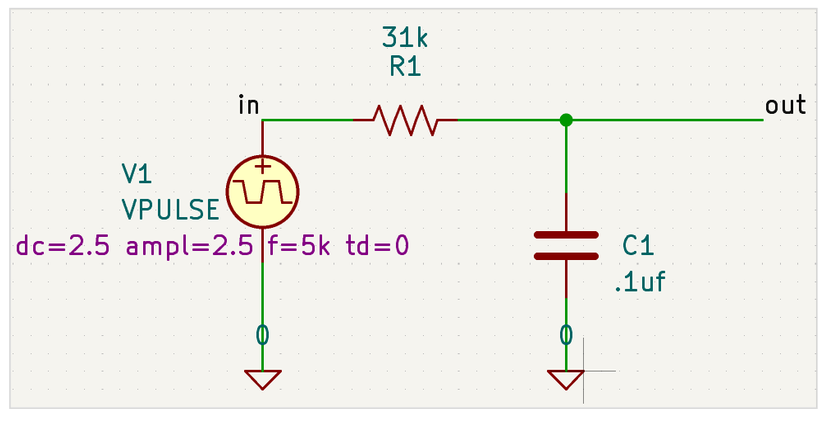
1. Build the Circuit Layout
 |
|---|
KiCAD RC Circuit |
- Open KiCad Schematic Editor.
- Press A to open the Symbol Chooser and place the following components:
- Resistor ($R$): Generic resistor symbol.
- Capacitor ($C$): Generic capacitor symbol.
- Power / Voltage Source: Search for
VPULSEorVSINin theSimulation_SPICElibrary. - Ground: Press P or search for
GND.
- Wire the components into an RC low-pass configuration (Voltage Source $\rightarrow$ Resistor $\rightarrow$ Capacitor to Ground).
- Press L to add Net Labels to your key signal lines:
- Label the node between the source and resistor as
in. - Label the node between the resistor and capacitor as
out.
- Label the node between the source and resistor as
2. Configure Component Values and SPICE Models
- Double-click the Resistor and set its value to
31k. - Double-click the Capacitor and set its value to
0.1uf(or100n). - Double-click the
VPULSEsource to assign its excitation properties:- Via Parameter Window: Right-click the component $\rightarrow$ Properties $\rightarrow$ Simulation Model $\rightarrow$ Select Source tab $\rightarrow$ Choose Pulse.
- Key Settings for a 5 kHz Pulse:
- Initial value ($V_1$):
0 - Pulsed value ($V_2$):
5 - Period ($PER$):
200u($1 / 5\text{ kHz}$) - Pulse width ($PW$):
100u($50%$ duty cycle) - Rise/Fall time ($TR$/$TF$):
1n
- Initial value ($V_1$):
3. Configure and Run the Simulation
- From the top menu, go to Inspect $\rightarrow$ Simulator.
- Click Simulate $\rightarrow$ Setup (or the gear icon) to choose your analysis type:
Transient Analysis (Time-Domain Waveforms)
- Select the TRAN — Transient Analysis tab.
- Time step:
10u(captures fine waveform details). - Final time:
2m(runs for 2 milliseconds to display 10 full cycles). - Click OK, then click the green Run Simulation button.
AC Sweep (Frequency Response / Bode Plot)
- Select the AC — Small-Signal Analysis tab.
- Variation:
Decade - Number of points:
100 - Start frequency:
1(1 Hz) - Stop frequency:
100k(100 kHz)
4. Plot and Measure Waveforms
- In the right-hand panel under Signals, check the boxes next to the nodes you want to display:
- Check
V(in)to view the input signal. - Check
V(out)to view the filtered output signal.
- Check
- Use the built-in measurement tools:
- Check Cursor 1 next to a signal name to enable an interactive measurement cursor on the graph.
- Drag the cursor line across the plot to measure exact peak voltages, DC offset, or rise times.